Factor premiums are risk-adjusted returns that have a strong economic or behavioral rationale. The most common factors are value, momentum, quality, low volatility and size. Factor investing is done by designing a portfolio of stocks using parameters representing a particular factor. For example, one may use high sales to price or high earnings to price among others to buy value stocks. Similarly, each factor is represented by particular parameters. The benefit of factor-based portfolio construction is that one can back-test these rules over a long period of time going back many decades.
This helps in analyzing the robustness of the factor over various macros and micro cycles. Traditional discretionary fund involves relying on the expertise of the fund manager in picking stocks. For many traditional funds, one has to rely on the past track record of the manager for evaluation. It is often challenging to find enough funds with long track records for this purpose. Factors on the other hand can be easily back-tested over a very long period. On the other hand, the benefits of traditional investment methods are that an experienced manager can use various qualitative information in their portfolio construction that cannot be easily used in a factor-based model. Factor-based and traditional discretionary investing are complementary to each other. Any investor should evaluate to have both as part of their allocation.
What makes momentum investing viable?
Momentum factor is categorized as a behavioral factor which is measured using the change in the price of a stock over a period of time. A momentum portfolio selects stocks with higher total returns compared to their peers. The rationale behind momentum is that this upward or downward trend, driven by market sentiment, would continue for some more time and can be used to generate returns. It is one of the most robust factors which has proven successful globally and also in Indian markets. Even though the factor generates very high returns, it is combined with large draw-downs in bearish markets. But the high risk-adjusted returns provide investors with a strategy that should provide great wealth-creation opportunities over a longer period. For investors who may not like the high volatility of the momentum portfolio, it can be combined with other factors such as quality or value to reduce the drawdown effects because of the low correlation between factors.
How important is Factor investing amid high inflation?
Factor investing has a long history of being used in professional fund management over many decades, especially in the US. Academic research and backtesting have shown it to have worked over a century of available data. Even though factors are affected by macro events such as inflation, it is important to note that their risk-adjusted premiums are robust over the medium to longer term. This is why even though macro events might affect the returns in the short term, the viability of factor investing has survived many such market cycles. Also, not all factors are affected by the same macro event, so a multi-factor approach is advisable in case one wants to reduce the cyclicality of an individual factor return.
How the consistency of Factors relates to the World of Investing?
Each of the factor premiums exists because of robust economic or behavioral rationale. This premium has been shown to persist over the medium to long term across multiple geographies. But each individual factor behaves differently in various market cycles which makes a single factor cyclical in nature over the short term. The persistence of risk-adjusted return from factor investing has been proven to work across a long period not only through academic research and backtesting through historical data, but also through the robust live performance of factor-based funds globally and in India. Consistent and patient investment in factor based strategies has shown to be a great way of long term wealth creation. The rule based approach has the added advantage of providing transparency in the stock selection process and explanation for the return attribution of a portfolio which has been one of the biggest reasons for its success at both institutional and retail levels globally and increasing domestically as well.
Multi-Factor Investing
In cricket, the team’s overall composition frequently matters more than any one star player. And just like different players in the cricket team tend to have different phases of performance, individual factors can undergo prolonged underperformance with impatient investors running out of patience before reaping their benefits. Just as a team combines the individual strengths of its players, a multi-factor strategy has the potential to overcome the cyclicality of the factors combined.
A successful team in cricket is often about the composition of the team rather than the individual star player.
The relationship between single factor and multi-factor strategies is no different in this regard – the team is the combination of the individual factors into one multi-factor strategy. A factor can undergo prolonged periods of underperformance with disillusioned investors running out of patience before the benefit of exposure to that factor is reaped.
There is no right or wrong answer as to how many and which factors to include in a strategy, but all the benefits of diversification apply to factor investing as well. A multi-factor approach can offer diversification and smoothen the ride through the investment journey by harvesting multiple sources of returns.
The challenge of a multi-factor portfolio is to decide how many factors to include and what approach to take. The answers can be easily found in the investor preference and objectives themselves. Investors who prioritize returns over costs may prefer a portfolio strategy dominated by momentum, while those with a strong preference for stable, consistent returns may consider low volatility to be the foundation of their portfolio. When designing a strategy for an astute investor segment with higher risk tolerance, one may consider concentrated single factor strategies to be appropriate. On the other hand, when designing a strategy for a wide variety of investors, a multi-factor strategy may serve the purpose best.
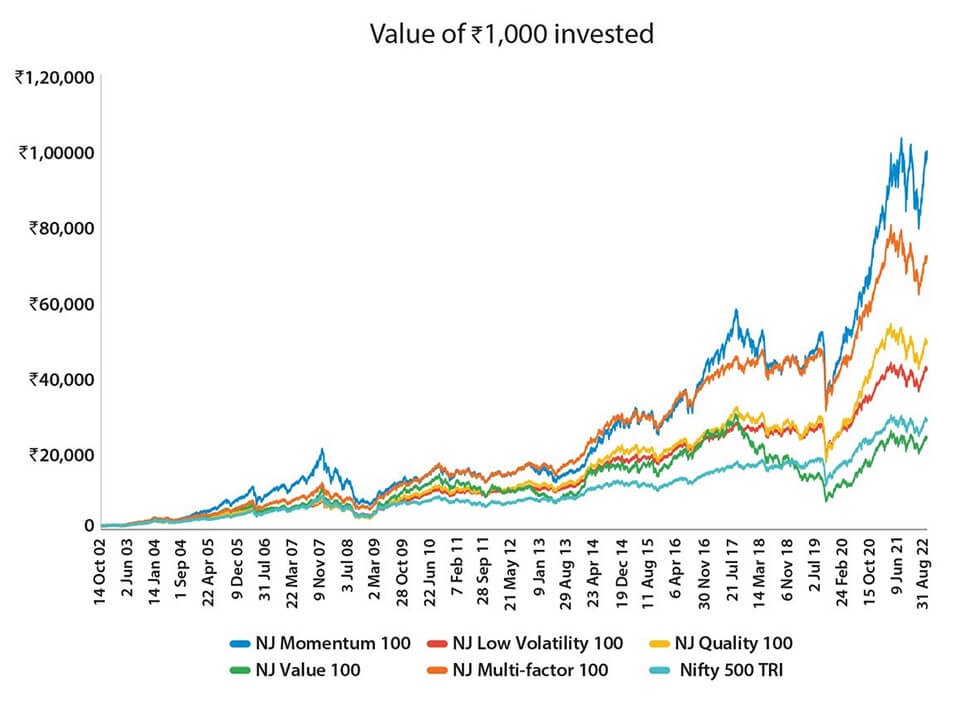
- Source: NJ research, Bloomberg, National Stock Exchange
- Calculations are for the period Oct 2002 to Aug 2022.
- Source: NJ research, Bloomberg, National Stock Exchange
- Calculations are for the period Oct 2002 to Aug 2022.
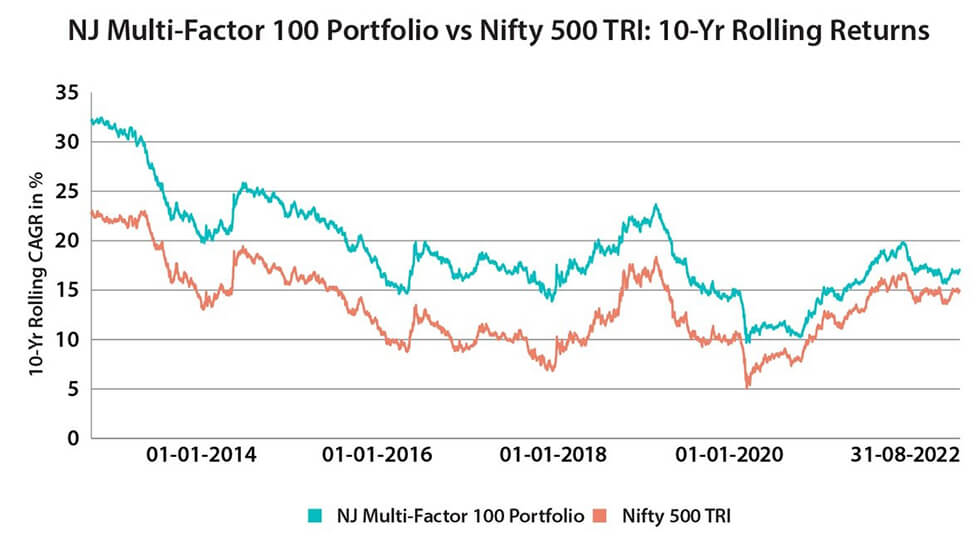
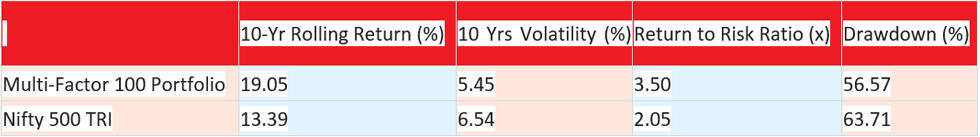
- Source: NJ research, Bloomberg, National Stock Exchange
- 10-Yr CAGRs are calculated for the period 30 September 2002 to 31st August 2022 and have been rolled on a daily basis.
How multi- factor strategy can help in your portfolio construction?
Single factors as explained above, have high risk-adjusted returns along with higher volatility and cyclicality in their returns due to various macro business cycles. But the various factors also have a low correlation to each other given the diversity in the rationale for the persistence of their premiums. This low correlation provides the benefits of diversification when two or more factors are combined to achieve a much smoother risk-adjusted return, say for example by combining quality, value, low volatility and momentum. Factor strategy returns have shown to perform better than the market benchmark over the medium to longer term and should be an important wealth creation allocation for any investor.